- Scholastic Alchemy
- Posts
- Education Reads to Start Your Week, March 23rd
Education Reads to Start Your Week, March 23rd
Norms Standards and School Policy, Anti-ready, Math Standards Battles
James Shanahan
March 23, 2026
Hi! This is Scholastic Alchemy, a twice-weekly blog where I write about education and related topics. Mondays usually see me posting a selection of education links and some commentary about each and Wednesday posts are typically a deep dive into an education topic of my choosing. If Scholastic Alchemy had a thesis, I suppose it would go a little like this: We keep trying to induce educational gold from lead and it keeps not working but we keep on trying. My goal here is to talk about curriculum, instruction, policy, public opinion, and other topics in order to explain why I think we keep failing to produce this magical educational gold. If you find that at all interesting, please consider a paid subscription here, or at the parallel publishing spot on Beehiiv. (Some folks hate the ‘stack, I get it.) That said, all posts are going to remain free for the foreseeable future. Thanks for reading!
Norms, Standards, and School Policy
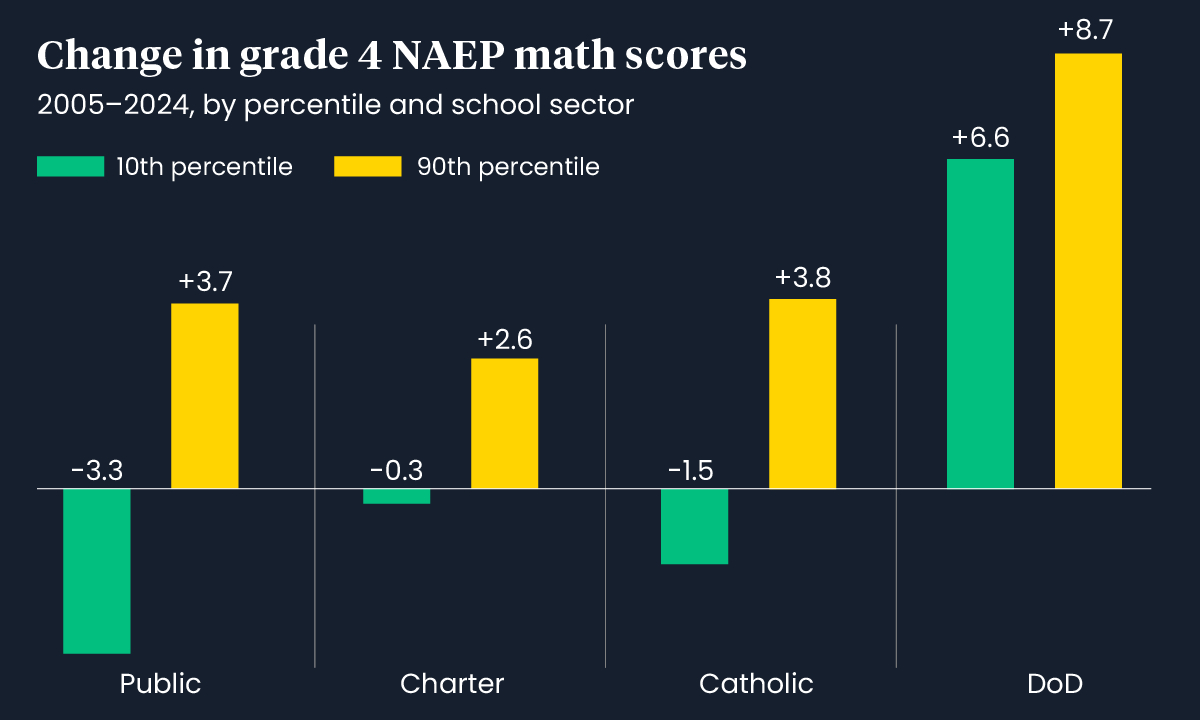
The 74, an outlet funded largely by mid-aughts school reform types, has an article reporting on a paper about the growing gap between the 90th percentile of students and the 10th percentile of students. The general gist of the problem is that kids ranked in the bottom 10th percentile of students (90% of students do better than these kids) are losing ground on the NAEP as the years go by while the top 10% of students (90% of students do worse than these kids) are improving. One of the interesting things about this data is that they break out charter schools, Catholic schools (that choose to participate in NAEP), and the Department of Defense Schools. The 74 brings us this graph.
source
You can read the whole paper here. One thing that stands out to me is that the authors of the paper devote a section in the discussion to call out teachers’ unions and public health officials for school closures during the COVID pandemic. This is sort of core to their overall point, because they find that that score declines for the bottom 10% worsened post-pandemic, especially in public schools.
A meaningful decline in the 10th percentile scores in TPS only preceded the pandemic for 4th grade reading. For the other three grade/subject categories, 10th percentile scores were flat before tanking during COVID and not recovering. The extensive school closings in TPS during the COVID pandemic, demanded by teacher union officials and supported by many public health officials (DeAngelis & Makridis, 2021; Patrinos, Jakubowski & Gajderowicz, 2025), appear to have had a disproportionate negative effect on 10th percentile students, almost exclusively explaining their average achievement drop from 2005 to 2024.
The thing is, I’m not sure their analysis is sensitive to differences in Covid responses across different school jurisdictions. Despite talking about unions, there is no comparison of NAEP scores between states with strong unions, states with unions that can’t collectively bargain, and states without teachers’ unions. They simply lump all traditional public schools together as unionized. Likewise, they assume that schools everywhere were closed in similar ways, when the reality had reopenings all over the place. I’m not being unfair here, it’s how they describe their calculations.
To assess linear annual trends, the 90th and 10th percentile scores, and the 90–10 gap scores, were regressed on year for each category within a grade, subject, and school sector. Equation (1) displays the regression of achievement scale-score type t (90th, 10th, or 90–10 gap) in year y, grade g, subject s, and school sector k for a category c on year y, where 𝜀𝜀 denotes the standard error. 𝛽𝛽0 displays the intercept and 𝛽𝛽𝑦𝑦 is the coefficient of interest. Figures plot the per-decade change based on yearly coefficients from regressions covering 2005-2024 (Shakeel & Peterson, 2022). The plots display results for pre-COVID (PC) 2005-2019 and full term (FT) 2005-2024, thereby revealing how COVID affected the change-per-decade.
The pandemic for them becomes a simple pre- and post- line they draw and form a comparison of scores across either side. If you’re familiar with the NAEP, you will know that the score reports don’t include granular enough data to drill down by district or form cross-jurisdictional comparisons. You might say, James, this is silly, they can’t tell you what you want them to tell you because their data set doesn’t include that kind of information. You’re right! But that statement cuts both ways. There’s not enough data here to make any claims about public health measures or school unionization’s impact on NAEP scores. It is inappropriate for them to argue that their data shows negative impacts of unions and public health measures. I’m not sure why this jab is here except to offer up some grist for the anti-union mill. Covid clearly made things worse but that’s kind of all you can say. Kids in Texas were back in school by Sept 2020. Kids in New Jersey were back literally two years later than that. They don’t get to be in the same comparative bucket.
Similarly, the authors recommend a bunch of policies that they don’t actually examine in the paper.
Clearly, policymakers and TPS practitioners need to focus on reducing the yawning gap in achievement between high- and low-performing students by improving outcomes for students at the lower end of the distribution. There are several policy interventions proven to be effective in boosting achievement in schools, including high-dosage tutoring, instruction consistent with the science of reading, and extended learning time (Fryer Jr & Howard-Noveck, 2020; Grissmer et al., 2023; Jez & Wassmer, 2015; Robinson, Kraft, Loeb, & Schueler, 2021). These interventions need to be made available to more low-achieving students in TPS.
So, to be clear, public health and unions: bad. Science of Reading, high-dose tutoring, and extended learning time: good. We know this not because of work the authors did in this paper, but because they cited other peoples’ work who make these claims. What, then, is the purpose of this paper. How does this analysis of NAEP scores add anything new to our understanding of learning outcomes? How does this analysis of NAEP scores imply, for example, that the Science of Reading is going to boost NAEP scores? I’m not objecting to the veracity of these claims so much as saying that the authors didn’t do any work justify or support these claims. I’m left not really understating what the point of the paper is.
But, we have to recognize that there is a game being played here, too. Peter Greene recently republished a decade-old essay that touches on the challenges of policy discussions that confuse standards-referenced tests like the NAEP with norm-referenced tests, like the SAT or, appropriate for the paper and article above, percentile distributions.
One feature of a standards-referenced test is that while we might tend to expect a bell-shaped curve of results (a few failures, a few top scores, and most in the middle), such a curve is not required or enforced. Every student in my class can get an A on the spelling test. Everyone can get a drivers license. With standards referenced testing, clustering is itself a piece of useful data; if all of my students score less than ten on my twenty word test, then something is wrong.
A norm-referenced test compares every student to every other student. The lines between different levels of achievement will be set after the test has been taken and corrected. Then the results are laid out, and the lines between levels (cut scores) are set.
When I give my twenty word spelling test, I can’t set the grade levels until I correct it. Depending on the results, I may “discover” that an A is anything over a fifteen, twelve is Doing Okay, and anything under nine is failing. Or I may find that twenty is an A, nineteen is okay, and eighteen or less is failing. If you have ever been in a class where grades are curved, you were in a class that used norm referencing.
Greene is largely critical of using normed tests to compare across years of test takers or between meaningfully different groups of students. Moreover, because the process of norming requires fitting kids to a bell-curve, some kids have to fail in order to create the normal distribution.
Now, the NAEP has none of these problems because it’s a standardized test. Passing and failure are possible for all kids, that how we can measure changes in achievement across various groups. Kids’ performance on the NAEP doesn’t depend on the performance of all other kids taking it. Unless, of course, fancy statisticians decide they need to norm the NAEP data in order to make some kind of argument about the relative performance of groups taking the test. For Greene, this presents some problems. He uses the example of what it might mean to read “at grade level”.
How about “reading on grade level”? At the end of the day, there are only two ways to determine what third grade “grade level” is-- you can either look at all all the third graders you can get data for and say, “Well, it looks like most of them get up to about here” or you can say “I personally believe that all third graders should be able to get to right about here” and just set it yourself based on your own personal opinion.
While lots of people have taken a shot at setting “grade level” in a variety of ways, it boils down to those two techniques, and mostly we rely on the first, which is norm-referencing. Which means that there will always be people who read below grade level-- always. The only way to show the some, more or all students are reading above grade level is to screw around with where we draw the “grade level” line on the big bell curve. But other than doing that kind of cheating with the data analysis, there is no way to get all students reading above grade level. If all third graders can read and comprehend Crime and Punishment, then Crime and Punishment is a third grade reading level book, and the kid in your class who has trouble grasping the full significance of Raskolnikov’s dream of the whipped mare as a symbol of gratification through punishment and abasement is the third grader who gets a D on her paper.
So, I’m not exactly sure what to make of the paper. I think the headline data is right and kids performance on the NAEP has been somewhat worse over the last two decades with a big post-covid decline. None of that, though, is new information. That we can see smaller declines in Carters and Catholic schools is interesting, too. After all, they can benefit from selection bias to construct a group of testers more apt to perform well on the NAEP. I they also saw declines, then it shows that something bigger than just public-school policy is going on.
Still, drawing any meaningful conclusions from this study is hard. Certainly some of their implications don’t seem to stem from the data but from prior commitments of the authors. Unfortunately, their proposed solutions seem to get picked up in the education media and reported out uncritically. Unfortunately, this also drives school policy. And we wonder why reforms don’t often work out the way we intend!
Anti-ready
Here’s the rub:
District and school administrators like iReady because it gives them the illusion of insight into student progress. Eyes into the classroom.
To be fair, iReady offers a reasonable screener. However, its reliability is overstated, and it’s incredibly time-consuming. Districts should ask whether the juice is worth the squeeze.
Use of iReady for “differentiated instruction,” on the other hand, is hugely problematic, because it isn’t actually personalizing learning at a fine-grained level.
But it offers the illusion of finely-tailored instruction, and district leaders are falling for the con.
The fact that kids hate iReady, thanks to its clunky user experience, just adds fuel to the fire.
In this two-part series, we unpack key issues with iReady’s assessments and supplemental materials1 , which account for most of the company’s $750 million in annual revenue.
Now, I don’t have a ton to add here. I’m generally an edTech skeptic and have seen schools and districts waste time and money endlessly pursuing technological fixes when they could be building out better supports for teachers and students. Rather, I think this is an important data point in the ongoing backlash to edtech we’re seeing. Parents are frustrated, kids are unhappy, and teachers are reporting lots of negatives. We should take this stuff seriously! Rather than rehash old points or try to jump on with the linked post, I want to pivot to one of the less talked-about problems with edtech, and that’s a lack of ongoing support.
Three weeks ago, Mark Watkins attended OpenAI’s 2026 education summit. He has a lot to say so definitely read the whole post but one thing he pointed out is that it’s hopelessly naive to assume that students will limit themselves to the educational versions of AI products. OpenAI, however, didn’t seem to discuss that very much.
Unfortunately, there was no roadmap or vision for shifting students from the free version of ChatGPT to the educational version of the tool, and there is an undeniable tension there that cannot be ignored. Students are using the free version of ChatGPT to study and learn, but they’re also using it to commit academic fraud by cheating, becoming addicted to easy answers, eroding their critical thinking skills, and running afoul of sycophantic responses. Before universities go all in and purchase expensive education licenses of ChatGPT, I think OpenAI and other AI developers need to establish more meaningful guardrails in the free or private version of their tools; otherwise, there’s not much reason students have for ditching those plans.
Still, Mark came away generally enthusiastic about some of the other tools they showed off, especially some of the things they are building to support teachers. It’s too bad, then, that OpenAI is probably not going to put much time and energy into education anymore. The Wall St. Journal reports that OpenAI held an emergency all-hands meeting last month where they previewed a major reorganization of the company toward a focus on business and productivity product lines.
OpenAI’s top executives are finalizing plans for a major strategy shift to refocus the company around coding and business users, recognizing that a “do everything all at once” strategy has put them on the defensive.
Fidji Simo, OpenAI’s CEO of applications, previewed the changes to employees in an all-hands meeting, telling them that top leaders including CEO Sam Altman and chief research officer Mark Chen were actively looking at which areas to deprioritize. They expect to notify staff about the changes in the coming weeks.
“We cannot miss this moment because we are distracted by side quests,” Simo told staff last week, according to remarks reviewed by The Wall Street Journal. “We really have to nail productivity in general and particularly productivity on the business front.”
I’m sure some of those productivity and business “quests” will provide some value for education, but it’s clear that schools won’t be a major focus for the company anymore. And that, friends, is the problem with education technology. If you’re a school district that was persuaded by slick presentations at the 2026 education summit, how do you feel right now? If you ponied up millions of dollars for district-wide access to products that might be abandonware, is there some audit or accountability for this decision to spend taxpayer money? Sorry guys, kids’ learning is a “side quest” and we’re not doing those anymore.
So, when I read about iReady or any other edTech, one thing I keep in mind is that at any point the company might just decide to stop supporting the product and leave you hanging. Better to slowly and purposefully develop the capacity to do these things yourselves, at least at the state level.
And that’s more than 2700 words with just 2 things to go read, so maybe let’s stop there. No. Wait. There’s more.
Math Standards Battles
Steven Yoder at The Hechinger Report, uh, reports on conservatives’ efforts to simplify mathematics standards in South Dakota and, potentially, nationwide. Much of this is downstream from the anti-Common Core fervor of a decade ago, now reinvigorated by today’s culture wars. At the center of this effort is a right-wing organization, The National Association of Scholars.
The 39-year-old organization has focused in recent years on revising state standards, which it says are “the single most influential documents in America’s education systems,” affecting curriculum, teaching training, textbook content and more. It started in 2022 with social studies standards, releasing model standards that call liberty an “American birthright” and describe civics instruction advanced by mainstream groups like the National Council for the Social Studies as a “recruitment tool of the progressive left.”
The National Association of Scholars then turned to science standards in 2024 and math standards last year. In 2026, it unveiled new model standards for English language arts.
In introducing the Archimedes math standards, the association says that while Common Core has “useful elements,” it isn’t demanding enough and “was rushed into public use without sufficient testing and evaluation.” The group says that the Archimedes standards will improve students’ ability to do math in their heads by requiring more memorization, contrasting them with the Common Core’s “deemphasizing” of math facts. The standards ban the use of calculators before high school.
Their key goal, though, is “lucidity” — standards that are easier for teachers and parents to understand. In an introduction to the Archimedes standards, the association contrasts a Common Core second grade standard on addition and subtraction that takes 67 words to explain with Archimedes’ 24-word version.
The standards were authored for the association by Jonathan Gregg, an assistant education professor at Hillsdale College, a small Christian liberal arts college in southern Michigan whose president chaired Donald Trump’s 1776 Commission on “patriotic education” in 2020. Gregg said in an interview that his background — undergraduate degrees in math and English, a master’s in humanities and a doctorate in math education — equipped him to write the draft standards in simple prose.
Yoder provides a helpful example of what these changes look like in practice.

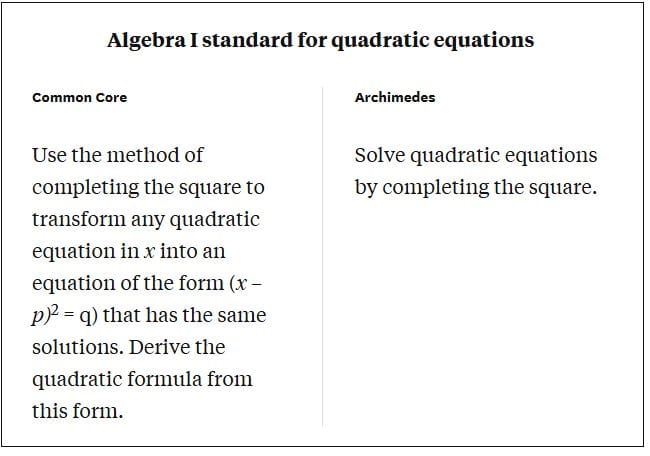
They certainly are simple. Oddly, this puts a lot more emphasis on the teachers’ professional judgement as to how to meet these standards. That said, if South Dakota is doing any kind of standardized testing, it’s going to be difficult to know what will be on the tests from the language of the standards. This will mean teachers may not adequately teach skills and concepts that will be tested. Maybe that’s the point?
Okay, now we’re done! Thanks for reading and have a good week.